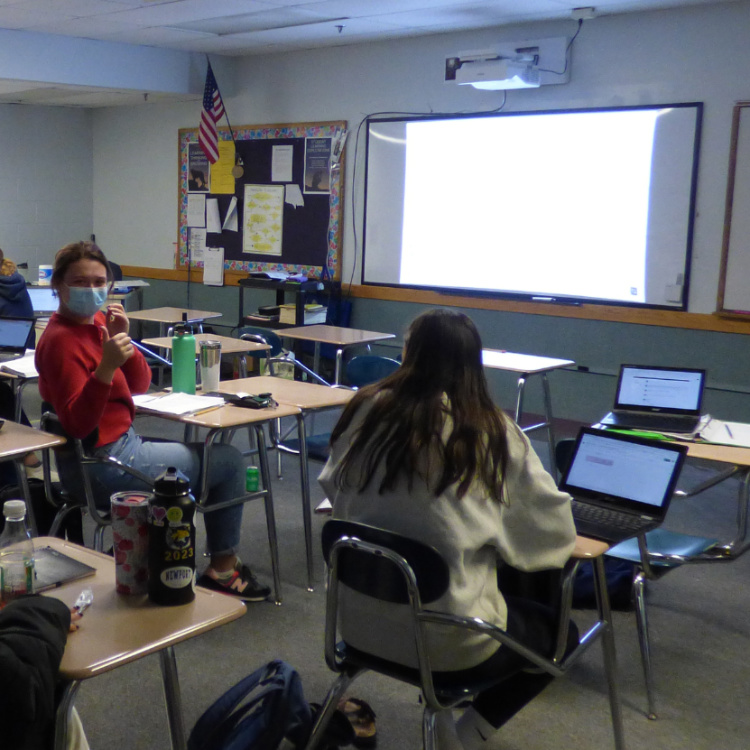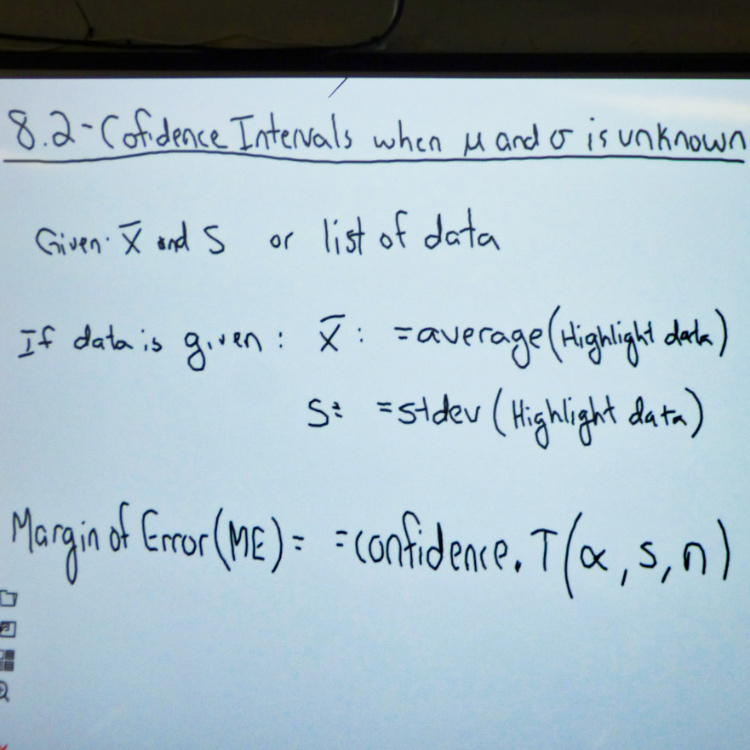
There is an air of friendly competition among the 25 juniors and seniors in Sam Winslow’s Statistics class. Today’s challenge to the students who are working in groups or individually: to determine confidence intervals when certain variables, such as the population mean (μ), are unknown.
A confidence interval displays the probability that a certain parameter will fall between a pair of values around the mean. In other words, it measures the degree of certainty or uncertainty in a sampling method. Confidence intervals are most often constructed using levels of 95% or 99%.
For example, if a survey is conducted on a sample of a population (e.g., sample n=100 out of a city population of N=100,000), the confidence interval tells you both the possible range around the estimate and also how stable the estimate is. A stable estimate is one that would be close to the same value if the survey were repeated.