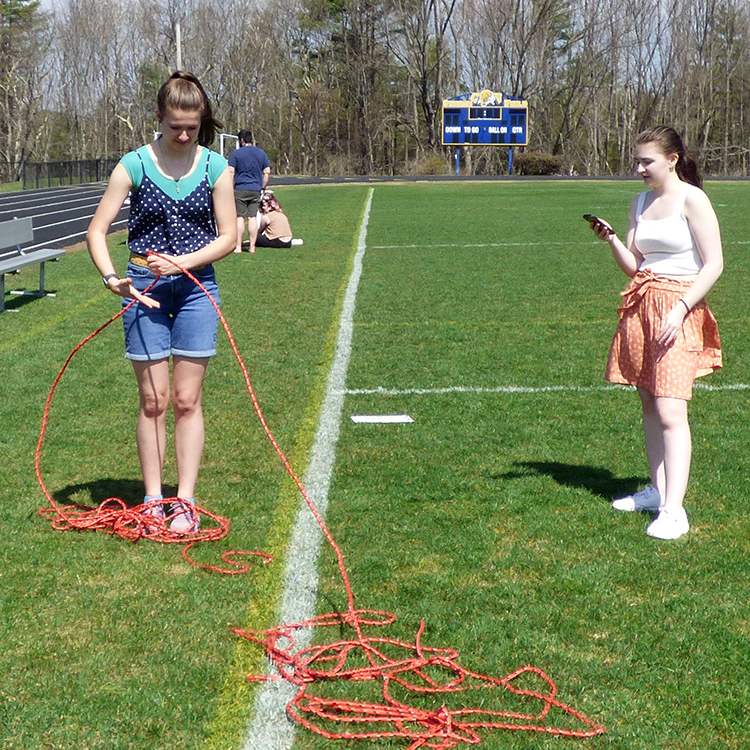
Sam Winslow’s Statistics classes during first and third blocks found themselves out on the athletic fields on Friday in pursuit of statistical data generation and analysis.
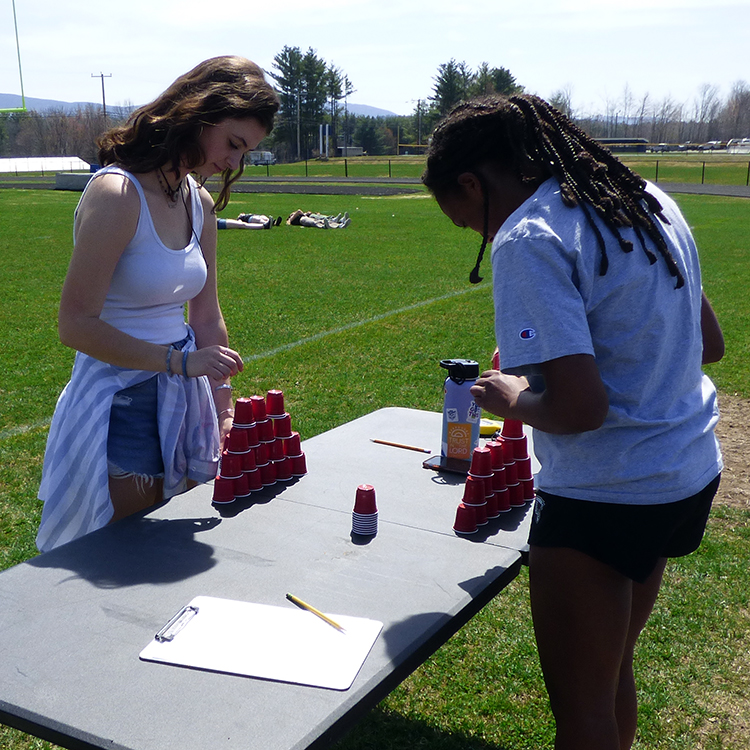
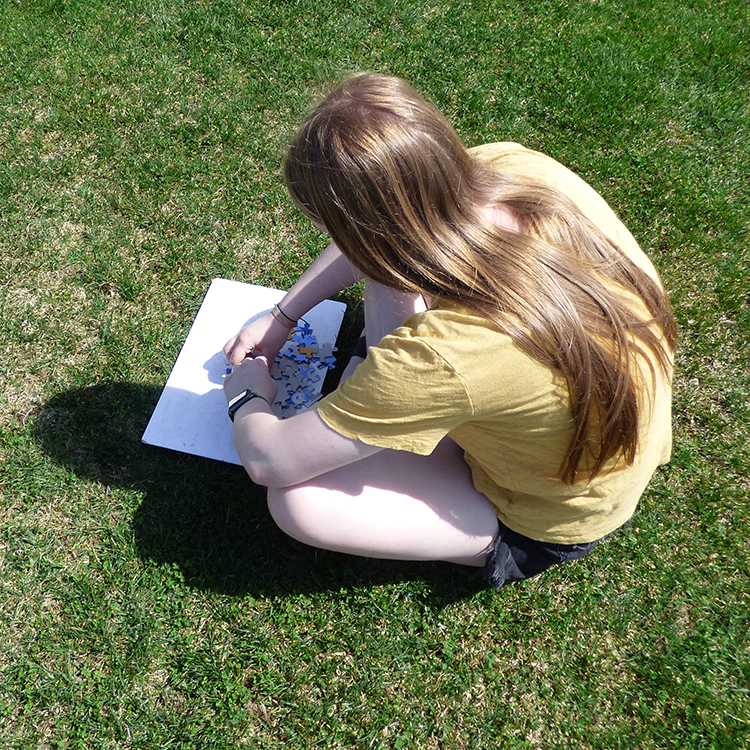
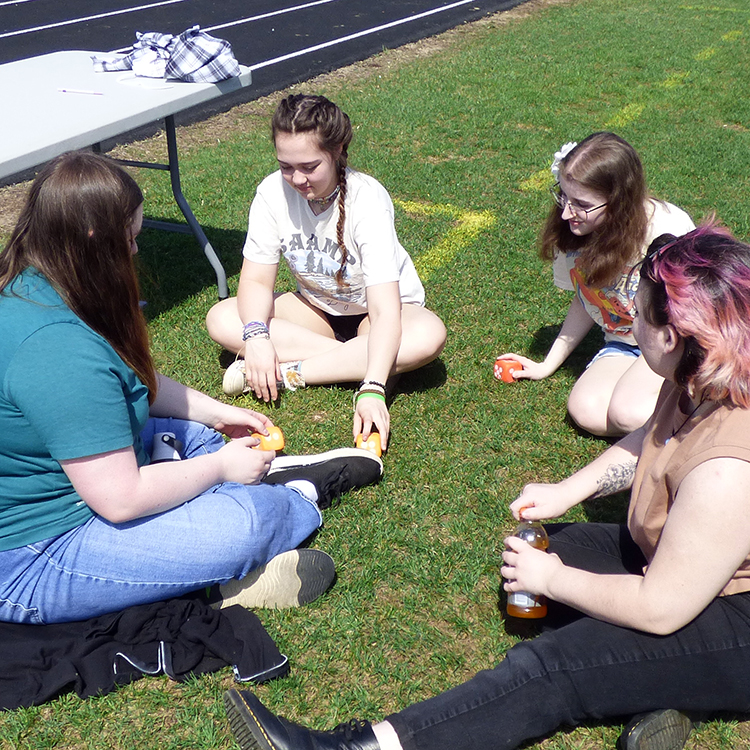
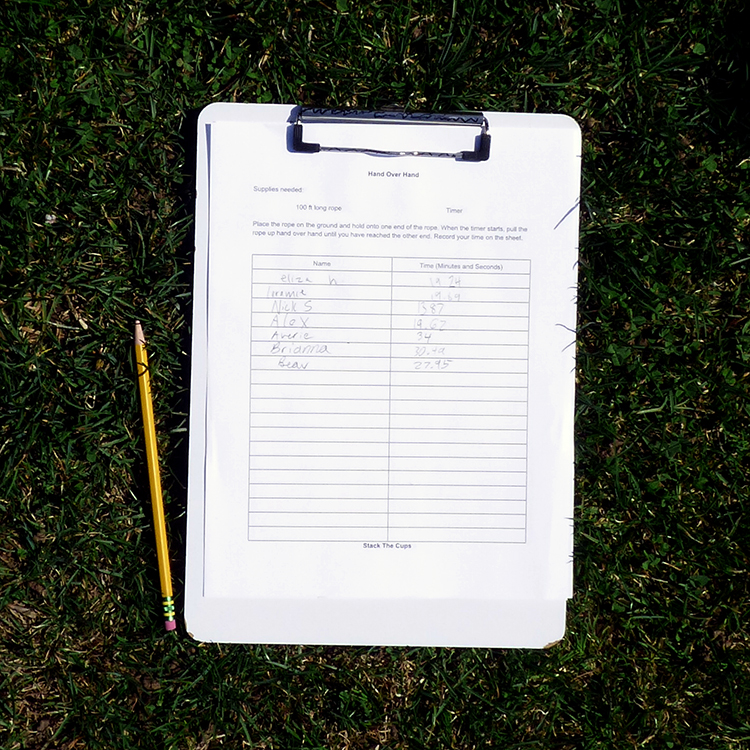
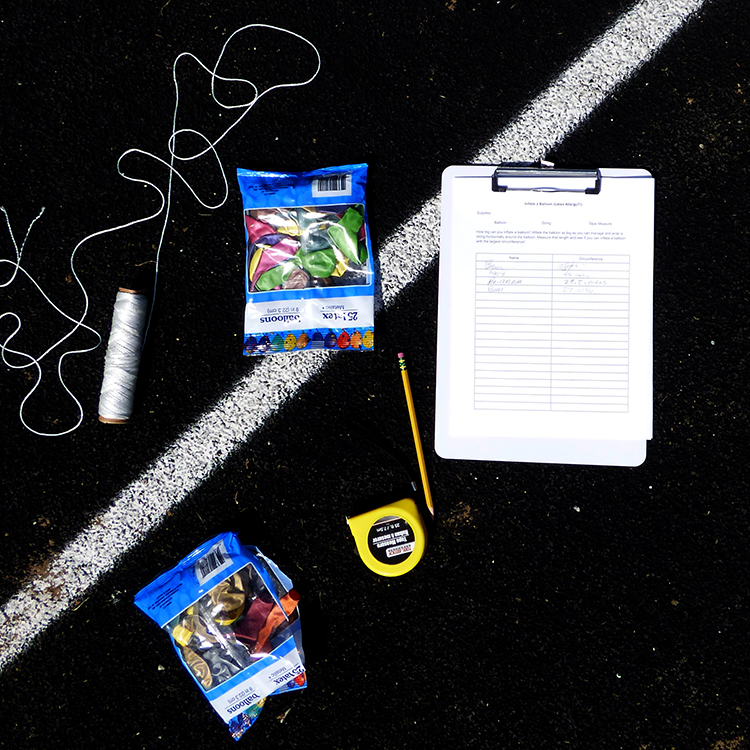
Winslow had set up ten different stations which asked students to complete tasks such as pulling a rope hand-over-hand, stacking cups, putting together puzzles, and throwing dice. Students measured their completion times or how frequently events occurred, such as any one of the dice coming up with the number 6.
The aim of this exercise in applied statistics was to generate data in a fun way and to use them for statistical concepts, such as tendency (mean, median, mode), variability (range, variance, standard deviation), and others. Students analyzed the data in terms of in-class comparisons between students and established comparisons with the respective other section of the course.
“Collecting data to make statistical comparisons of two different sections of Statistics students was the best way to illustrate the complete workflow from data generation to analysis,” said Winslow.